

puremdiimport volume:
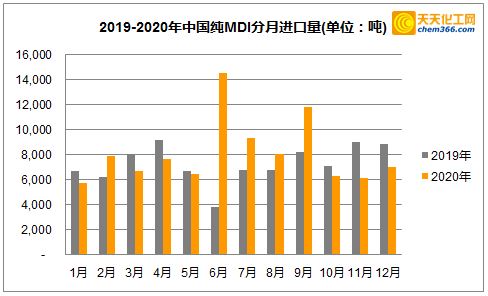
2020year12month, china puremdithe import volume is7,014.87t, chain ratio growth14.8%, year-on-year decrease20.7% .
2020year1-12month, chinese puremdithe cumulative import volume is97,356.14 tons, year-on-year growth11.6% .
japan and korea is pure chinesemdithe top two import sources (by import weight). pure from japan and south korea span>the number accounts for the total85.0%.
table1. 2020 year12month china puremdiimport source, import quantity, import amount and import unit price
|
serial number |
import source |
import quantity (tons) |
import amount (usd) |
import unit price (usd/t) |
|
1 |
japan |
3,650.12 |
6,743,330 |
3,075.10 |
|
2 |
south korea |
2,313.75 |
5,637,625 |
3,394.84 |
|
|
japan and south korea total |
5,963.87 |
19,079,276 |
3,199.15 |
|
|
total |
6109.39 |
14,054,726 |
2,985.10 |
| 37.1% | ||||
|
20 |
egypt |
692 |
1,163 |
-40.5% |
|
other |
2,260 |
3,780 |
-40.2% |
|
|
total |
98,596 |
111,710 |
-11.7% |
description: table3 and table4puremdiexport volume, all from china customs29291030the total export under the tariff number quantitative data.
an style=”font-size:8pt”>-11.7%
description: table3 and table4puremdiexport volume, all from china customs29291030the total export under the tariff number quantitative data.